Analyzing Player Returns Through Aggregated Data on Digital Game Payout Percentages
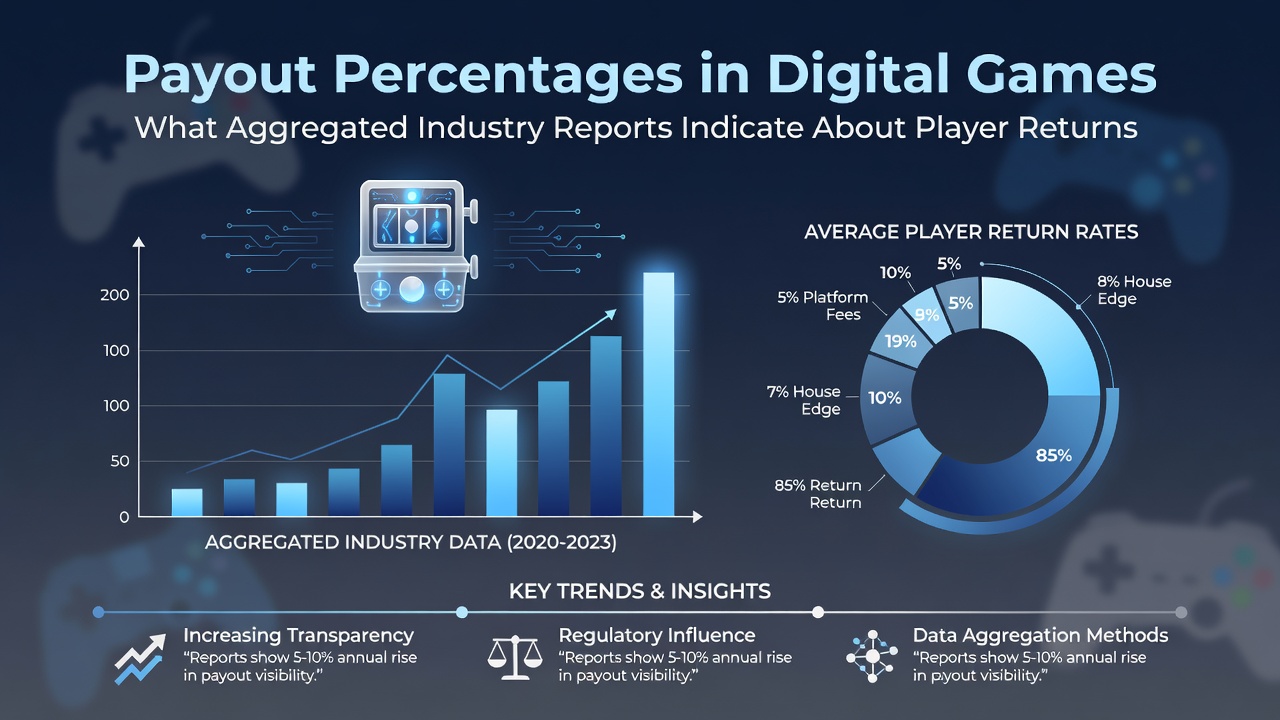
Digital games operate with payout percentages that represent the proportion of wagers returned to players over extended periods, and aggregated industry reports compile these figures from multiple operators and jurisdictions to reveal broader patterns in player returns. These percentages, often labeled as return-to-player or RTP rates, derive from mathematical models embedded in game software, while reports draw on millions of transactions to calculate averages that account for game type, platform, and regulatory environment. Observers note that such data provides a clearer picture than individual operator disclosures because it smooths out variations caused by specific game libraries or regional rules.
How Aggregated Reports Calculate and Present RTP Figures
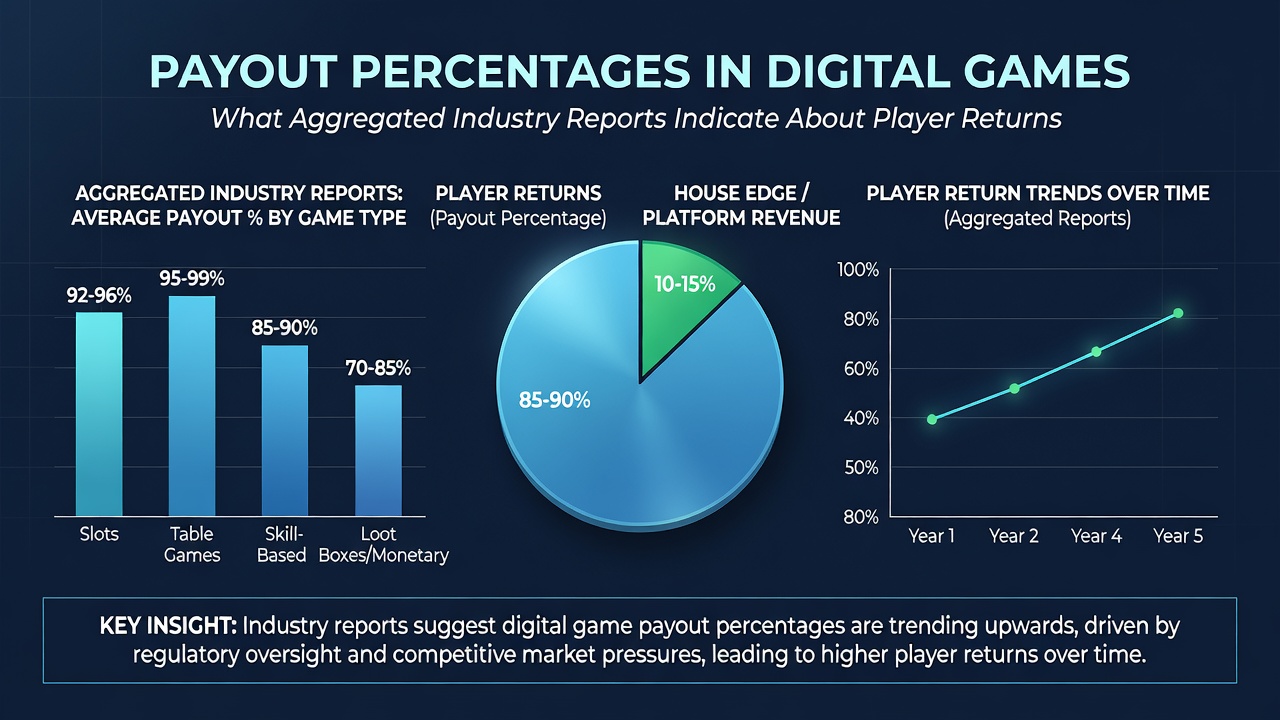
Industry analysts gather raw transaction data from licensed platforms, then apply statistical methods to determine average returns across categories like video slots, table games, and instant-win formats, and they publish summaries that highlight medians rather than outliers. Reports from regulatory bodies in different regions feed into these aggregates, which allows comparisons between markets where rules differ on minimum RTP thresholds or audit frequencies. Data shows that slots frequently cluster between 94 and 97 percent in multi-jurisdiction compilations, whereas table games with skill elements post slightly higher averages because player decisions influence outcomes more directly.
Researchers cross-reference these numbers with hold percentages, which measure the operator's retained share, and the resulting figures indicate that digital environments maintain consistent returns regardless of session length when sample sizes reach the billions of spins or hands. What's interesting is how reports separate RNG-certified titles from those with progressive jackpots, since the latter introduce wider variance that affects short-term player experiences even as long-term aggregates remain stable.
Regional Data Patterns Emerging in Mid-2026
By August 2026, compilations covering the first half of the year have incorporated transaction volumes from North American and European markets, revealing modest upward shifts in average RTP for certain digital categories compared with 2025 baselines. Figures from the Nevada Gaming Control Board show that regulated online offerings maintained slot RTPs near 95.2 percent across aggregated pools, while similar datasets from Canadian provincial regulators place video poker returns around 96.8 percent when multiple operators contribute records. These numbers reflect ongoing software updates and certification processes rather than any single policy change.
Reports also segment returns by game volatility, demonstrating that low-volatility titles deliver steadier but smaller payouts that align closely with theoretical percentages, whereas high-volatility games exhibit larger deviations that resolve toward the mean only after extensive play. Aggregators emphasize that these patterns hold across desktop and mobile interfaces, with no measurable difference in RTP once the same certified RNG governs both formats.
Game Category Comparisons in Recent Aggregations
Slots continue to dominate volume in digital reports, and aggregated data places their overall return at approximately 95.4 percent when thousands of titles from diverse providers combine into single datasets. Blackjack and roulette variants post higher medians near 97 percent because their fixed rules limit the house edge more predictably, while video poker sits in between depending on the paytable configurations chosen by operators. Industry organizations tracking these metrics note that progressive jackpot games pull the slot average slightly lower in any given quarter because the seed amounts and contribution rates create temporary dips before jackpots reset.
One study revealed that mobile-only sessions produce RTP figures indistinguishable from desktop play once sample sizes exceed several million rounds, confirming that delivery method does not alter the underlying mathematics. Those who've examined multi-year trends observe that certification standards tightened in several jurisdictions during 2025, which contributed to narrower gaps between theoretical and realized returns across the board.
Implications for Understanding Long-Term Player Outcomes
Aggregated reports make clear that payout percentages function as statistical guarantees rather than session-specific predictors, and players encounter variance that can exceed or fall short of published averages during any finite number of plays. Data indicates that transparency improves when multiple regulators contribute to the same dataset, since single-market figures sometimes reflect local minimums that differ from global norms. External audits from laboratories such as those accredited by the International Association of Gaming Laboratories further validate the numbers that appear in these summaries.
Conclusion
Aggregated industry reports therefore supply the most reliable window into digital game returns by pooling verified transaction data across operators and regions, and they continue to show stable RTP ranges that vary primarily by game category rather than platform or geography. Figures compiled through August 2026 reinforce earlier patterns while highlighting incremental improvements tied to updated certification requirements. Continued collection of such data will allow ongoing comparisons that track how regulatory and technological shifts influence the percentages players ultimately experience.